
 ×
×
Wirtschaftliche Auslegung eines Co-Location-Speichers.
Ein reproduzierbares Vorgehen, um die wirtschaftlich optimale Speichergröße zu bestimmen und sie in eine real umsetzbare Auslegung zu überführen. Schritt für Schritt an einem PV-Projekt von greentech in Deutschland, berechnet mit Catalyst von phelas.
greentech ist ein integrierter Solar- und Speicherspezialist und deckt die gesamte Wertschöpfung ab — von der Projektentwicklung über Planung und Bau bis zur Betriebsführung sowie dem Asset Management von PV-Kraftwerken und Batterie-Energiespeichersystemen (BESS). Insbesondere die Ergänzung von PV um BESS kann einen doppelten Mehrwert schaffen: Sie stabilisiert die Einspeisung und erhöht häufig zugleich die wirtschaftliche Attraktivität im Vergleich zu reinen PV-Projekten. Für die Ermittlung der optimalen Speicher-Auslegung nutzt greentech die Anwendung Catalyst von phelas.
Was der optimale Speicher bringt
Der richtig dimensionierte Speicher erhöht die Projektrendite (IRR) gegenüber der reinen PV-Variante.
Projekt-IRR (EQ)
+0,66 pp ggü. PV-Referenz
Im Optimum
40% des Netzanschlusses
Speicherwert
Anteil am Projektumsatz
01 · Fünf Dinge, die man wissen sollte
Der richtig dimensionierte Speicher steigert die Rendite.
Der PV-Park teilt sich einen gemeinsamen Netzanschluss. Ohne Speicher erzielt er eine vergleichsweise niedrige IRR von 8,69%.
Ein optimal dimensionierter Speicher erhöht sie auf 9,35% IRR — ein Plus von 0,66 Prozentpunkten. Die entscheidende Frage ist, welche Speicherauslegung die Rendite maximiert.
Mithilfe von Catalyst wurden 20 Speichervarianten anhand von zwei PV-Erzeugungsprofilen bewertet. Die IRR ist in beiden Profilen bei 40% des Netzanschlusses und 3 Speicherstunden am höchsten. Die real umsetzbare Auslegung — vorgegeben durch eine standardisierte Trafostation — liegt bei ~45% / 2,8 h, genau im optimalen Bereich.
01Der Speicher steigert die Projektrendite.
PV allein erzielt eine IRR von 8,69%. Der richtig dimensionierte Speicher erhöht sie auf 9,35% — ein Plus von 0,66 Prozentpunkten, das die Wirtschaftlichkeit des Projekts zusätzlich verbessert.
02Die IRR ist am höchsten bei 40% Leistung / 3 Stunden.
In beiden PV-Erzeugungsprofilen liegt die Konfiguration mit der höchsten IRR bei 40% des Netzanschlusses über 3 Stunden — das ist das Auslegungsziel.
03Mehr Speicher bedeutet nicht automatisch mehr Rendite.
Erhöht man die Speicherleistung auf 80–100%, steigen die Investitionskosten überproportional zu den zusätzlichen Erlösen, sodass die IRR unter das Niveau des No-Storage-Szenarios sinkt. Das wirtschaftliche Optimum wird deutlich vor der Maximalgröße erreicht.
04Die umsetzbare Auslegung ≈ das Optimum.
Kein Trafo und kein Wechselrichter bilden exakt 40% des Netzanschlusses ab; die geplante Auslegung wird daher um eine standardisierte Trafostation herum konzipiert — ~45% / 2,8 h. Weil die IRR-Kurve nahe ihrem Maximum flach verläuft, wird damit praktisch das volle Potenzial des Auslegungsziels ausgeschöpft.
05Robuste Ergebnisse gegenüber dem PV-Ertrag.
Geprüft sowohl für ein Median- (P50) als auch für ein konservatives (P90) Erzeugungsjahr: Der Speicher steigert in beiden Fällen die IRR, und das Optimum bleibt bei 40% / 3 h — unabhängig davon, wie sonnig das Jahr ausfällt.
Kernergebnis
Basisfall (P50) · Optimum 40% / 3 h ggü. PV-Referenz
Projekt-IRR
ohne Speicher
8,69%
mit Speicher
9,35%
+0,66 pp ggü. PV-Referenz
Optimum → geplant
40% Ziel · ~45% geplant, an einer standardisierten Trafostation · in Planung
- Speicher-CapEx im Optimum
- 3,62 Mio. €
- Projekt-CapEx gesamt
- 15,53 Mio. €
- PV-Erzeugungsprofile
- 2 (P50 · P90)
- Varianten je Profil
- 20 + PV-Referenz
02 · Auslegung mit System
Da die Erlöse zunehmend über den freien Markt erzielt werden und die Förderung sinkt, sind reine PV-Projekte oft nicht mehr attraktiv genug — sie liegen genau auf oder knapp unter der Renditeschwelle der Investoren. Ein Co-Location-Speicher erschließt über abgeregelte Energie und Preisschwankungen eine zweite Erlösquelle. Doch der wirtschaftliche Nutzen hängt vollständig von der richtigen Größe ab: Ist der Speicher zu groß, rechnet sich die Mehrinvestition nie; ist er zu klein, bleibt das Ertragspotenzial ungenutzt.
Die richtige Größe lässt sich also nicht per Faustregel bestimmen, sondern ist das Ergebnis einer Optimierung. Die fünf unten stehenden Schritte zeigen das Vorgehen, das greentech mit Hilfe von Catalyst bei diesem Projekt angewendet hat.
Projektrahmen festlegen
Netzanschluss, PV-Profil, die Auslegungsfrage.
Szenarien definieren
Zwei PV-Erzeugungsprofile, Median und konservativ.
Mit Catalyst simulieren
Jede Größe, jedes Profil — sortiert nach IRR.
Optimum ablesen
Wo die Rendite am höchsten ist: 40% Leistung / 3 h.
Von Theorie zu Praxis
Das Ziel in eine beschaffbare Auslegung überführen.
Schritt 1 · Das Projekt
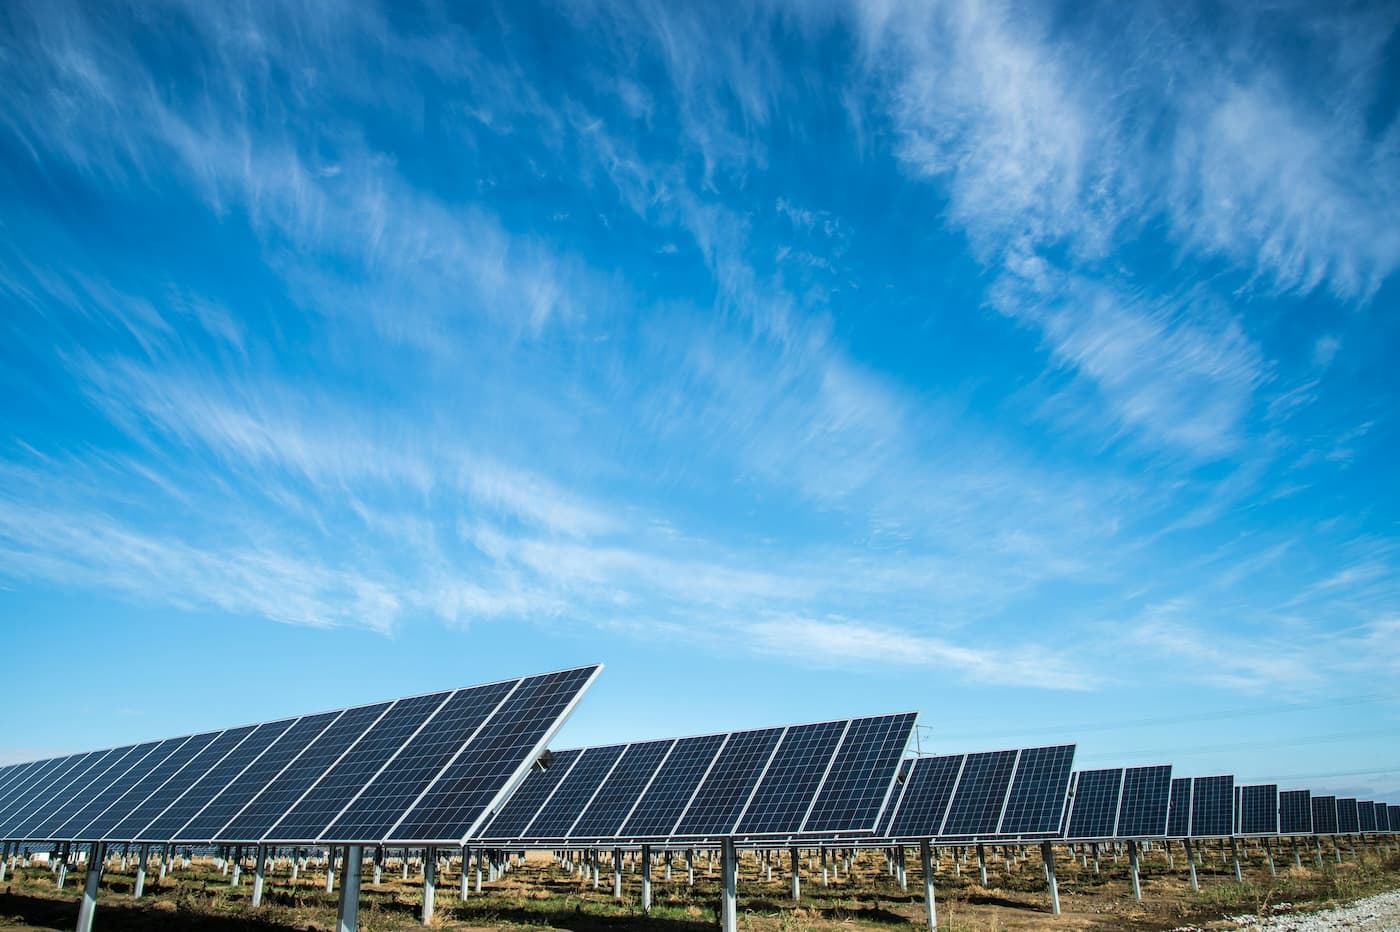
Ein PV-Park in Deutschland teilt sich einen gemeinsamen Netzanschlusspunkt mit einem Lithium-Speicher (Co-Location). Beide Anlagen werden gemeinsam optimiert: Die PV-Anlage kann ihren Strom entweder direkt über die Direktvermarktung absetzen oder den Speicher laden, der dann am Day-Ahead- und Intraday-Markt vermarktet wird. Die Batterie wird dabei ausschließlich aus dem PV-Park geladen — eine Ladung aus dem Netz findet nicht statt. Das Projekt ist ein realistischer und repräsentativer Anwendungsfall für die Speicherauslegung eines solchen PV-Grünstromspeichers.
Referenz (nur PV) vs. Co-Location (PV + Batterie)
Im Referenzszenario wird der PV-Strom direkt über den Netzanschluss eingespeist und über die Direktvermarktung (EEG-Prämie) abgesetzt; Überschüsse über dieses Limit hinaus werden abgeregelt. Im Co-Location-Szenario kann die PV-Anlage stattdessen die Batterie laden, die am Day-Ahead- und Intraday-Markt vermarktet wird — die Steuerung wird dabei gemeinsam mit der direkten PV-Einspeisung optimiert.
Erzeugungsanlage
PV-Park · Deutschland
Deutschland · PV-Leistung ~130% des Netzanschlusses (~1,3-fache Überbauung, Einspeiselimit) · Direktvermarktung (EEG-Prämie) · spürbare Abregelung ohne Speicher · CapEx 460 €/kWp (11,91 Mio. €)
Speichersystem
Lithium-Ionen-Speicher in Co-Location (BESS)
Simuliert für 5 Leistungsstufen (20–100%) × 4 Speicherdauern (1–4 h) · Day-Ahead- und Intraday-Vermarktung · Grünstrom-Betrieb (kein Netzbezug) · 20 Jahre Lebensdauer
Schritt 2 · Die Szenarien
Den Ertrag testen.
Der Solarertrag schwankt von Jahr zu Jahr; eine einzige Erzeugungsannahme liefert daher eine wenig belastbare Antwort. Das Projekt wird deshalb unter zwei PV-Erzeugungsprofilen bewertet — einem Median- (P50) und einem konservativen (P90) Jahr — jeweils auf dem zentralen Preispfad. Jede der 21 Konfigurationen läuft unter beiden Profilen, sodass sich die Auslegung auf Robustheit prüfen lässt: Das Optimum sollte Bestand haben, egal ob das Jahr sonnig ausfällt oder nicht.
Wie die 42 Business Cases zustande kommen
Speicher-Konfigurationen · Leistung × Speicherdauer
| 20% | 40% | 60% | 80% | 100% | |
|---|---|---|---|---|---|
| 1h | |||||
| 2h | |||||
| 3h | |||||
| 4h |
PV
kein Speicher
■ 40% / 3 h = wirtschaftliches Optimum
21 Konfigurationen (5 × 4 + kein Speicher)
PV-Erzeugungsprofile
P50
Median-Ertrag (Basis)
P90
konservativer Ertrag
2 Profile
42
Business Cases
zentraler Preispfad
Schritte 3 & 4 · Optimierung mit Catalyst · Ermittlung der maximalen Rendite
Statt nur eine einzige vorab angenommene Größe zu prüfen, optimiert Catalyst den PV-Park und den Speicher gemeinsam auf Viertelstundenbasis. Jede Konfiguration wird parallel bewertet — alle Kombinationen aus Leistung und Kapazität synchron. Der Durchlauf umfasst 5 Leistungsstufen × 4 Speicherdauern plus die reine PV-Referenz, jeweils für beide PV-Profile. Daraus resultiert für jeden Fall ein vollständiger Projekt-Cashflow und die entsprechende IRR. Das Ergebnis ist keine bloße Einzelempfehlung, sondern ein vollständiges Renditebild, das das Optimum — und die finanziellen Einbußen bei einer Abweichung — klar aufzeigt.
Wie die IRR gebildet wird · greentech-Arbeitsannahmen
Inflation
2%
Laufzeit
30 J.
PV 30 J. · BESS 20 J.
PV-CapEx
460 €/kW
PV-OpEx
3,3%
Speicher-CapEx
138–292
€/kWh je Speicherdauer + 5 €/kW
Speicher-OpEx
3,5%
Speicher-Lebensdauer
20 J.
stillgelegt, kein Ersatz
Ladung
nur PV
grün, kein Netz
Märkte
DV · DA · ID
keine Regelleistung
Finanzierung
Unlevered
reine Eigenkapital-IRR
Die IRR wird über den gesamten 30-jährigen Projekt-Cashflow berechnet: Markterlöse abzüglich Betriebskosten und Investitionen (CapEx), bei 2% Inflation. Der PV-Park läuft die vollen 30 Jahre; die Batterie hat eine Lebensdauer von 20 Jahren und wird nicht ersetzt — nach Jahr 20 wird sie stillgelegt, ohne Re-CapEx. Die Speicher-CapEx reicht von 138,25 €/kWh (4-h-Systeme) bis 292 €/kWh (1-h-Systeme), zzgl. eines Leistungspreises von 5 €/kW. Regelleistungserlöse sind nicht modelliert, der Case ist also bewusst konservativ gerechnet. Alle IRRs sind unlevered berechnet (100% Eigenkapital, ohne Fremdfinanzierung) — eine weitere konservative Annahme, da Fremdkapital die Eigenkapitalrendite zusätzlich erhöhen würde (Fremdkapitalhebel).
Projekt-IRR vs. Speicherleistung · eine Kurve je Speicherdauer
P50 · Median-Ertrag (Basisfall)
Die geplante Auslegung (◇) hat eine Speicherdauer von 2,8 h und liegt damit zwischen der 2-h- und der 3-h-Kurve — mit rund 9,3% IRR im Basisfall praktisch auf dem Rendite-Plateau.
Optimum · P50
40% · 3 h
IRR-maximierend
- IRR (Optimum)
- 9,35%
- IRR (PV-Referenz)
- 8,69%
- IRR-Zuwachs
- +0,66 pp
- Speicher-CapEx
- 3,62 Mio. €
Der optimale Speicher steigert die IRR um +0,66 pp gegenüber der reinen PV-Variante.
IRR je Konfiguration (%) · P50
Alle Varianten im Vergleich — Optimum umrandet
| Dauer \ Leistung | 20% | 40% | 60% | 80% | 100% |
|---|---|---|---|---|---|
| 1 h | 8,47 | 8,51 | 8,57 | 8,46 | 8,25 |
| 2 h | 8,78 | 9,16 | 9,20 | 9,11 | 8,78 |
| 3 h | 8,94 | 9,35 | 9,30 | 9,01 | 8,48 |
| 4 h | 8,98 | 9,28 | 9,02 | 8,52 | 7,82 |
Zellen auf oder über der PV-Referenz sind grün eingefärbt, darunter rot — je tiefer die IRR, desto kräftiger das Rot. Bei beiden PV-Profilen liegt das Optimum bei 40% Leistung / 3 h.
Profilübergreifende Übersicht
PV-Referenz vs. optimaler Speicher — IRR je Erzeugungsprofil
| PV-Profil | Optimum | PV-Referenz IRR | Optimum IRR | IRR-Zuwachs |
|---|---|---|---|---|
| P50 · Median-Ertrag (Basisfall) | 40% / 3 h | 8,69% | 9,35% | +0,66 pp |
| P90 · konservativer Ertrag | 40% / 3 h | 7,68% | 8,50% | +0,82 pp |
Auf eine Zeile klicken, um dieses Profil oben zu laden.
⌀ Jahresumsatz nach Quelle · PV-Referenz vs. Optimum (40% / 3 h)
Aus einer Erlösquelle werden drei
Das Speichersystem leitet einen Teil des PV-Stroms in die Batterie, die am Day-Ahead- und Intraday-Markt vermarktet. Der Nettoumsatz steigt und speist sich aus drei teils unabhängigen Quellen. Die Abregelungsverluste sinken um rund 44% (nahezu halbiert). Durchschnitt über die Projektlaufzeit.
Speicheranteil am Umsatz
34%
- Direktvermarktung
- ~66%
- Intraday
- ~32%
- Day-Ahead
- ~2%
- Abregelung
- −44%
Der Intraday-Markt ist die Haupterlösquelle des Speichers. Regelleistungserlöse sind nicht modelliert, weshalb die Rendite eine konservative Untergrenze darstellt.
Das Rendite-Plateau · Basisfall (P50)
IRR ist nahe dem Optimum flach — die geplante Auslegung verliert fast nichts
Plateau
40% · 3 h
IRR-Optimum bei 3 h
- IRR (Optimum)
- 9,35%
- IRR (geplant, ~45% / 2,8 h)
- 9,30%
- Werterhalt ggü. Optimum
- 99,5%
Weil die IRR-Kurve nahe ihrem Maximum flach verläuft, kostet die praktisch umsetzbare Auslegung fast keine Rendite.
Schritt 5 · Vom Ziel zum Plan
Die Simulation hat 40% Leistung / 3 h Speicherdauer als wirtschaftliches Optimum ermittelt. Auf dem Markt ist jedoch kein Transformator oder Wechselrichter mit exakt dieser Leistung erhältlich. Daraus ergab sich die praxisrelevante Frage: Was lässt sich real beschaffen und wie sieht die konkrete technische Umsetzung aus? Die Antwort ist ein System auf Basis einer standardisierten Trafostation. Am Netzanschluss entspricht dies einem Leistungsanteil von ~45% und führt zu einer realen Speicherdauer von 2,8 statt der theoretischen 3 Stunden.
Das ist kein Kompromiss, sondern ein echter Vorteil. Da die IRR-Kurve nahe ihrem Maximum sehr flach verläuft, liegt die geplante Auslegung (~45% / 2,8 h) voll auf dem Rendite-Plateau: Die etwas höhere Leistung und die geringfügig kürzere Speicherdauer gleichen sich nahezu perfekt aus. Das System schöpft das wirtschaftliche Potenzial der Auslegungsoptimierung somit praktisch vollständig aus. Das System befindet sich derzeit in der Planungsphase.
Wirtschaftliches Ziel
40% · 3 h
Basisfall-IRR 9,35% (ggü. 8,69% der reinen PV-Variante).
Geplante Auslegung
~45% · 2,8 h
~45% des Netzanschlusses — ausgelegt auf Basis einer standardisierten Trafostation und marktverfügbarer Komponenten. In Planung.
Wertwirkung
≈ voller Upside
Auf dem flachen Maximum der IRR-Kurve schöpft die geplante Auslegung praktisch das gesamte Potenzial des Auslegungsziels aus.
Die Methodik im Überblick
Allgemeingültige Erkenntnisse für Co-Location-Projekte.
Dieses Projekt dient hier als konkretes Beispiel, doch die zugrundeliegende Methodik ist universell. Aus dieser Case Study lassen sich vier zentrale Kernbotschaften für die Auslegung von PV-Grünstromspeichern ableiten:
Learning 01
Speicherauslegung ist ein Optimierungsprozess, kein Standardprodukt.
Es gibt keine „richtige" Speichergröße von der Stange. Die IRR-maximierende Konfiguration hängt maßgeblich vom Netzanschlusslimit, dem spezifischen Erzeugungsprofil und den gewählten Strommärkten ab — sie muss präzise simuliert statt einfach angenommen werden.
Learning 02
Der reale Wert entsteht beim Praxistransfer, nicht im Modell.
Eine Simulation, die rein theoretische Werte wie „40% / 3 h" liefert, bietet noch keine solide Entscheidungsgrundlage. Der eigentliche Wert entsteht erst durch die Überführung in eine technisch umsetzbare, marktverfügbare Auslegung, die das Rendite-Plateau sichert — wie in diesem Fall das System auf Basis einer standardisierten Trafostation.
Learning 03
Überdimensionierung zerstört Rendite.
Jenseits des wirtschaftlichen Optimums fällt die IRR rasch unter die reine PV-Referenzlinie. Die zusätzlichen Investitionskosten (CapEx) erwirtschaften dann weniger, als sie kosten. Das wirtschaftliche Optimum ist daher deutlich vor dem maximalen energetischen Durchsatz erreicht.
Learning 04
Die Methode ist übertragbar — die Zahlen sind es nicht.
Jedes Projekt erfordert eine maßgeschneiderte Betrachtung. Ein anderer Standort, ein abweichendes Netzlimit oder ein verändertes Erzeugungsprofil verschieben das Optimum sofort. Jedes Projekt muss zwingend auf Basis seiner individuellen Parameter bewertet werden.
Ausblick
×Wie geht es weiter?
Auf die variantengestützte Wirtschaftlichkeitsrechnung mit Catalyst folgt der Schritt in Richtung Umsetzung: Aus den Ergebnissen entsteht ein belastbarer Business Case, der die gewählte Speichergröße nachvollziehbar begründet. Dazu werden die wichtigsten Annahmen transparent gemacht, Varianten verglichen und die wirtschaftlichen Auswirkungen für das konkrete Projekt klar dargestellt.
Neben der Entwicklung eigener Projekte unterstützt greentech auch externe Partner. Mit der Co-Location-Potenzialanalyse bewertet der Solar- und Speicherspezialist bestehende oder geplante PV-Standorte hinsichtlich ihrer Eignung für einen Batteriespeicher, prüft Netz- und Flächenrahmen, priorisiert sinnvolle PV-BESS-Optionen und begleitet anschließend auf Wunsch auch durch den Projektentwicklungs-Prozess bis zur Baureife.
Die Berechnung der IRR (Internal Rate of Return) basiert auf dem vollständigen 30-jährigen Projekt-Cashflow aus einer Co-Optimierung auf Viertelstundenbasis für ein Co-Location-Projekt in Deutschland (PV-Leistung ~130% des Netzanschlusses, ~1,3-fache Überbauung). Berücksichtigt werden die Direktvermarktung (mit EEG-Prämie) sowie der Day-Ahead- und der Intraday-Markt. Erlöse aus Regelleistungsmärkten sind nicht enthalten; das Speichersystem wird als Grünstromspeicher ausschließlich aus der PV-Anlage geladen. Die Simulation erfolgt auf Basis eines zentralen Preispfads für zwei PV-Erzeugungsprofile (P50 / P90). Cashflows enthalten 2% Inflation. PV-CapEx: 460 €/kWp (≈ 11,91 Mio. €), PV-OpEx 3,3% der CapEx p.a.; Speicher-CapEx 138–292 €/kWh zzgl. 5 €/kW, Speicher-OpEx 3,5% der CapEx p.a., 20 Jahre Speicher-Lebensdauer ohne Ersatz (nach Jahr 20 stillgelegt, kein Re-CapEx). Alle IRRs sind unlevered berechnet (reine Eigenkapitalrendite). Die dargestellte Studie umfasst 42 Business Cases. Die wirtschaftlichen Annahmen entsprechen dem Arbeitsmodell von greentech. Modellierte Ergebnisse sind eine Grundlage für Auslegungsentscheidungen und stellen keine Anlageberatung dar. Jedes Co-Location-Projekt ist auf seinen eigenen Parametern zu bewerten.
Eigene Projekte modellieren
Nutzen Sie die Methodik direkt für Ihre Projekte — mit individualisierten Szenarien, Standortparametern und auditfähigen Ergebnissen.